Price Action Trading Course by Dhaval Malvania

Price Action Trading Course by Dhaval Malvania 90 days to get-start disciplined trading Duration 3 Months (2 hours per day) Monday To Friday For Working Professional Time for Class is adjusted. for Evening batch. [note: try to get in class in morning session in live market to build psychology for trading.] Delivery : Online [By Cisco Webex, google meet , zoom ofline class as well] Investment – Retail price : Rs 15,000  Our Referral Customers : Rs 15,000  Next Batch starting from 15th May 2023 JOIN TODAY :    PART 1 Overview of financial markets Oppor tunities available in the world of trading Advantages of trading Why a majority of traders fail? What it takes to become a successful trader? How to kick-start your trading journey on the right note? Understanding Technical Analysis What is technical analysis? Advantages and limitations of technical analysis Different forms of technical analysis Important things to consider while usi...

sector wise stock list in excel

 sector wise stock list in excel

Sector wise Company List

SECTORAL INDICES

1 NIFTY BANK- DOWNLOAD HERE

NIFTY BANK

2 NIFTY AUTO DOWNLOAD HERE

NIFTY AUTO

3 NIFTY FINANCIAL SERVICES DOWNLOAD HERE

NIFTY FINANCIAL SERVICES

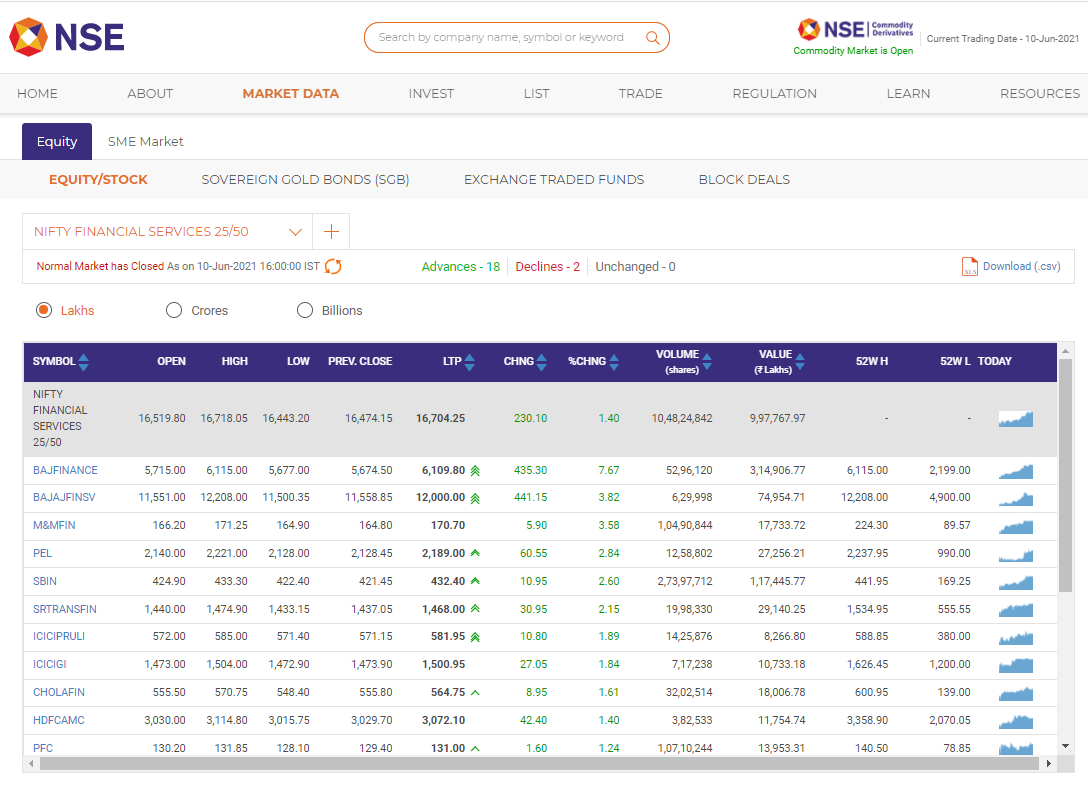
4 NIFTY FINANCIAL SERVICES 25/50 DOWNLOAD HERE

NIFTY FINANCIAL SERVICES 25-50

5 NIFTY FMCG DOWNLOAD HERE

NIFTY FMCG


6 NIFTY IT DOWNLOAD HERE

NIFTY IT


7 NIFTY MEDIA DOWNLOAD HERE

NIFTY MEDIA


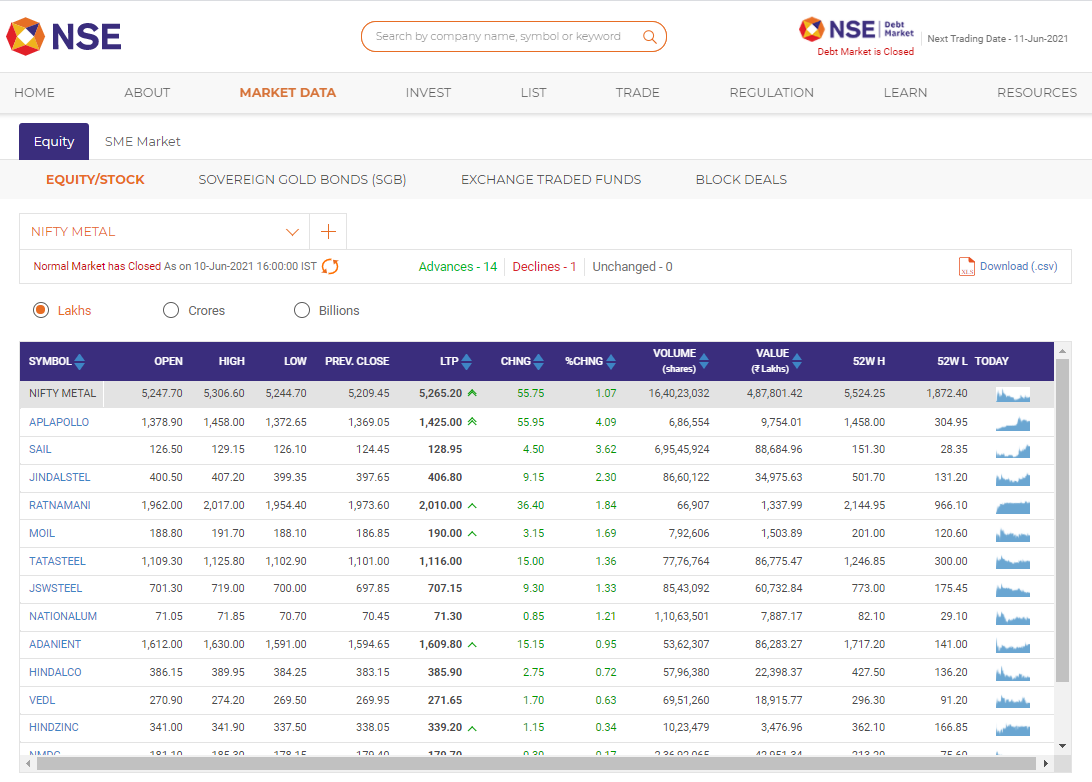
8 NIFTY METAL DOWNLOAD HERE

NIFTY METAL


9 NIFTY PHARMA DOWNLOAD HERE

NIFTY PHARMA


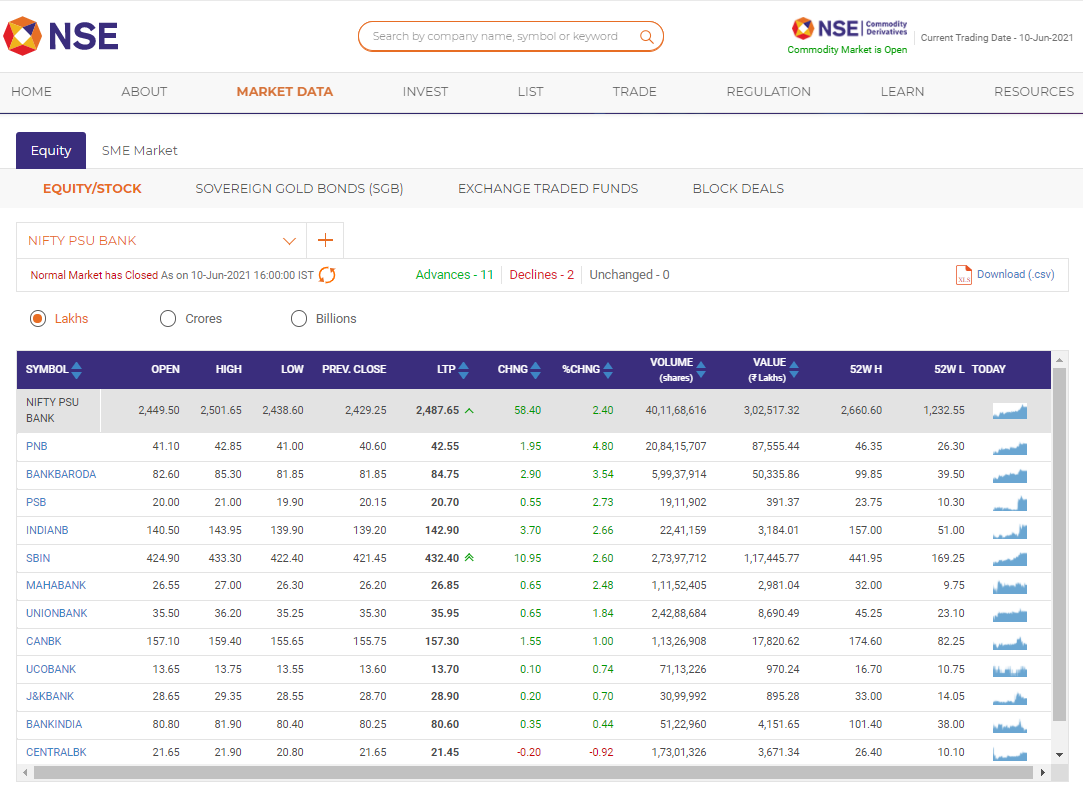
10 NIFTY PSU BANK DOWNLOAD HERE

NIFTY PSU BANK


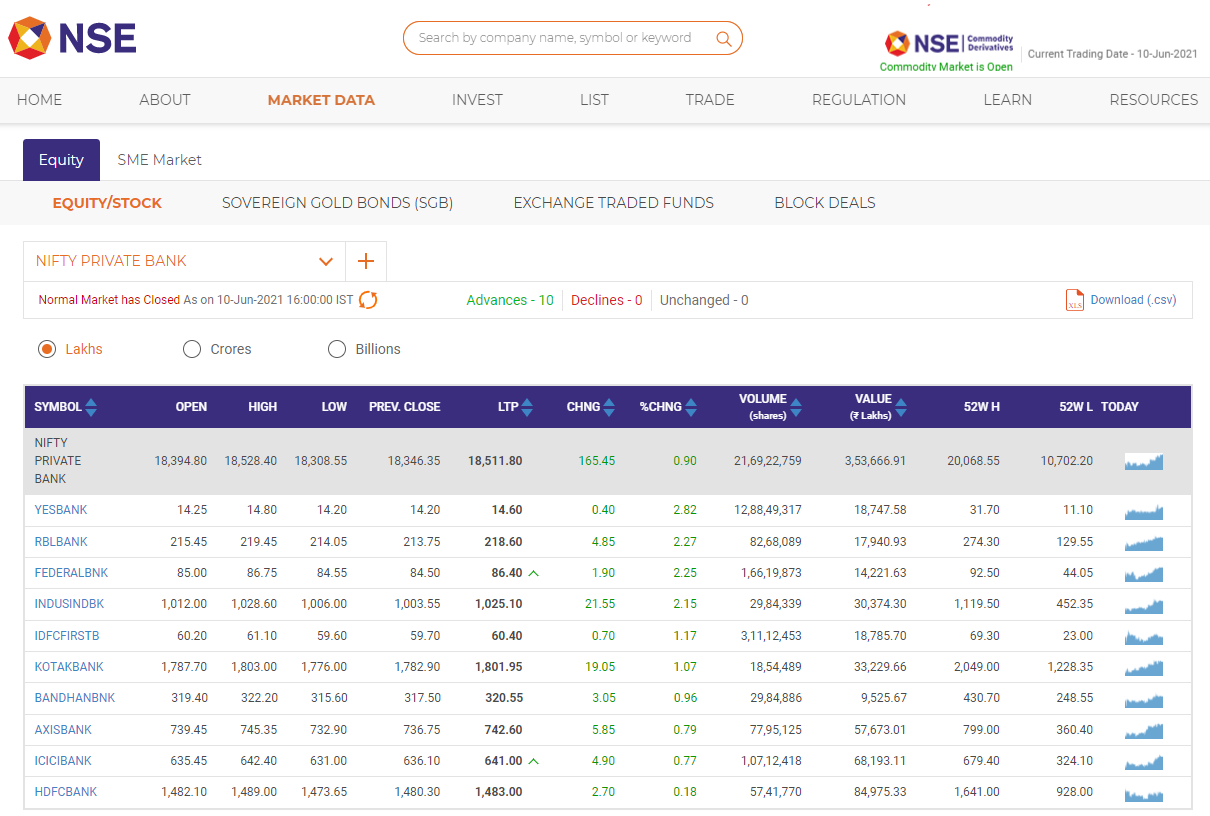
11 NIFTY PRIVATE BANK DOWNLOAD HERE

NIFTY PRIVATE BANK


12 NIFTY REALTY DOWNLOAD ERE

NIFTY REALTY

3 MAJOR INDEX OF NIFTY

1 NIFTY 50 DOWNLOAD HERE

NIFTY 50


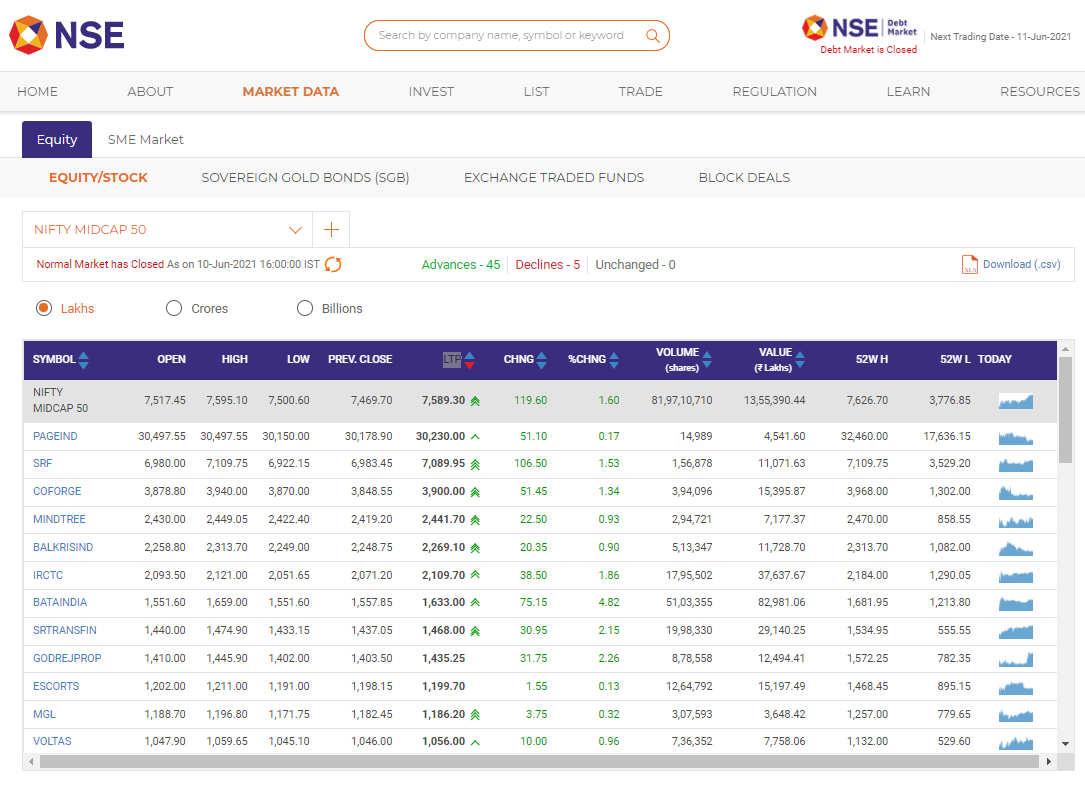
2 NIFTY MIDCAP 50 DOWNLOAD HERE

NIFTY MIDCAP 50


3 NIFTY SMALLCAP 50 DOWNLOAD HERE

NIFTY SMALL CAP 50

SECURITIES IN Future N Option DOWNLOAD HERE

SECURITIES IN FNO
Above are the major indexes in the stock market in that you can find the share you have traded in your life any where.
in THIS blog I have share you all index stocks in form of excel sheet so as you can download and identify their names in the different sectors.

INTRADAY STOCKS FOR 14-06-2021

MGL : 
Buy at / above: 1233.76   Targets: 1241.94 - 1250.76 - 1259.61 - 1268.5
Stoploss : 1225
Sell at / below: 1225   Targets: 1216.87 - 1208.16 - 1199.49 - 1190.84
Stoploss : 1233.76

CHART
MGL_Daily_13-06-2021

INTRADAY STOCK PERFORMANCE : 


MGL INTRADAY STOCK PERFORMANCE

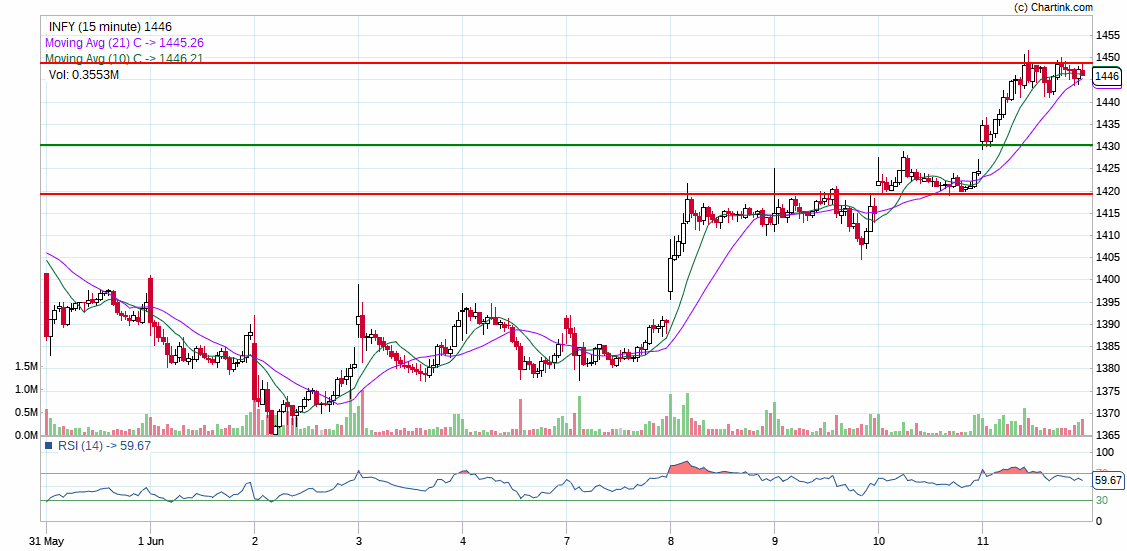
Infy:

Buy at / above: 1453.51   Targets: 1462.33 - 1471.9 - 1481.5 - 1491.14
Stoploss : 1444
Sell at / below: 1444   Targets: 1435.23 - 1425.77 - 1416.34 - 1406.95
Stoploss : 1453.51

CHART:

INFY_Daily_13-06-2021

INTRADAY STOCK PERFORMANCE : 

INFY INTRADAY STOCK PERFORMANCE


GODREJCP: 

Buy at / above: 900   Targets: 907.06 - 914.6 - 922.17 - 929.78
Stoploss : 892.51
Sell at / below: 892.51   Targets: 885.5 - 878.07 - 870.68 - 863.32
Stoploss : 900

CHART

GODREJCP_Daily_13-06-2021


INTRADAY STOCK PERFORMANCE : 

GODREJCP STOCK PERFORMANCE


TAGS

#INTRADAY #STOCK #FOR #TOMORROW #BY #DHAVALMALVANIA #STOCKSFORTOMORROW #INFY #GODREJCP #MGL #StocksToTrade #stockstowatch @DMalvania

SEARCH GOOGLE FOR : WHICH SECTOR OF STOCK MARKET MAY GO UP TODAY?, NSE STOCKS FOR TODAY BY DHAVAL MALVANIA

JOIN ONE OF THE BEST STOCK PREDICTION WEBSITE INDIA HAS.

IF YOU LIKE OUR ANALYSIS ON DAILY BASIS and wat to get it to you daily free then 

Click Here

CLICK BELOW LINK TO OPEN ACCOUNT IN ZERODHA ONLINE AND JOIN WITH US TO GET BENEFIT.

https://zerodha.com/open-account?c=ZMPELY


IF YOU LIKE OUR ANALYSIS ON DAILY BASIS PLEASE LET US KNOW IN THE COMMENT AND WE WILL HELP YOU LEARN TECHNICAL ANALYSIS IN OUR PAID COURSE

FEEL FREE TO CONTACT US IN CONTACT US PAGE WITH YOUR NAME MOBILE NUMBER AND EMAIL ADDRESS.


Comments

Popular posts from this blog

Top 10 Chartink Scanners Every Trader Should Know

 Top 10 Chartink Scanners Every Trader Should Know Meta Description: Discover the top 10 Chartink scanners for intraday and swing trading. Includes volume breakout, RSI oversold, moving average crossover, bullish engulfing, and more. 📌 Introduction If you are an active trader, you know how difficult it is to track hundreds of NSE stocks in real-time. That’s where Chartink stock screeners come in. Chartink allows you to create and use ready-made scanners to spot trading opportunities instantly. 🔟 Best Chartink Scanners for Traders 1. Breakout Above Yesterday’s High Condition: ``` Latest close > 1 day high AND Latest volume > 100000 ``` Use: Identifies stocks breaking out above the previous day’s high → strong intraday bullish signal. 2. Volume Breakout Scanner Condition: ``` Latest volume > 2 * 5 day average volume AND Latest close > Latest open ``` Use: Finds stocks with sudden volume surges (momentum plays). 3. RSI Oversold Reversal Co...

Price Action Trading Course by Dhaval Malvania

Price Action Trading Course by Dhaval Malvania 90 days to get-start disciplined trading Duration 3 Months (2 hours per day) Monday To Friday For Working Professional Time for Class is adjusted. for Evening batch. [note: try to get in class in morning session in live market to build psychology for trading.] Delivery : Online [By Cisco Webex, google meet , zoom ofline class as well] Investment – Retail price : Rs 15,000  Our Referral Customers : Rs 15,000  Next Batch starting from 15th May 2023 JOIN TODAY :    PART 1 Overview of financial markets Oppor tunities available in the world of trading Advantages of trading Why a majority of traders fail? What it takes to become a successful trader? How to kick-start your trading journey on the right note? Understanding Technical Analysis What is technical analysis? Advantages and limitations of technical analysis Different forms of technical analysis Important things to consider while usi...

How to Use Chartink Stock Screeners for Intraday Trading (Step-by-Step Guide)

 How to Use Chartink Stock Screeners for Intraday Trading (Step-by-Step Guide) Learn how to use Chartink stock screeners for intraday trading. Step-by-step guide with examples like breakout above yesterday’s high, plus top scanners every trader should know. Introduction Intraday trading requires quick decisions, and manually tracking hundreds of NSE stocks is almost impossible. That’s where Chartink comes in. Chartink is one of the most popular stock screeners in India, allowing traders to scan the market in real-time based on price, volume, indicators, and candlestick patterns. Step-by-Step Guide to Create Intraday Scanners 1. Visit Chartink Go to chartink.com . You don’t need to log in for basic usage, but creating an account helps save your scanners. [screenshot of Chartink homepage] 2. Open the Screener Builder Click on ‘Screener’ and then select ‘Create Scan.’ This opens the condition builder. [screenshot of condition builder] 3. Add Conditions For exam...

HOW TO APPLY IPO THROUGH UPI IN ZERODHA?

 HOW TO APPLY IPO THROUGH UPI IN ZERODHA? IF YOU HAVE TO APPLY IPO THROUGH ZERODHA YOU MUST HAVE ZERODHA DEMAT & TRADING ACCOUNT WITH YOU. IF you don't have zerodha account you can open it by clicking this link here. LOGIN TO YOU KITE.ZERODHA.COM OPEN YOUR CONSOLE MENU BY CLICKING ON YOUR CLIENT ID NOW GO TO PORTFOLIO > IPO. NOTE: TIME FOR APPLY IPO IN UPI METHOD THROUGH UPI IN ZERODHA IS OPEN FROM 10 AM TO 5 PM ON TRADING DAYS. YOU DON'T NEED TO HAVE MONEY IN YOUR ZERODHA TRADING ACCOUNT. MONEY FOR IPO WILL BE BLOCKED FROM BANK ONLY. NOW CLICK ON BID ON IPO YOU WANT TO APPLY FOR.  WHICH EVER IPO OPEN FOR APPLICATION WILL BE SHOWN IN LIST AS SHOWN IN ABOVE IMAGE. NOW AFTER YOU CLICK ON BID NEW WINDOW WILL OPEN ASKING YOU TO ENTER YOUR BHIM UPI ID  BESIDE THAT CLICK ON VERIFY [IF YOU ARE APPLYING YOUR IPO FOR THE FIRST TIME THROUGH ZERODHA UPI METHOD.] SELECT INVESTOR TYPE  select individual investor  QUANTITY & CUTOFF-PRICE then place quantity you w...